
🔍 Proof of Analysis - BTC
This is what happens when structure is followed

Good afternoon everyone 👋🏻
Welcome to our new Proof of Analysis series
The goal is very simple
I want to show in an easy to understand way how my analysis has worked
You will see:
A video
A before chart
An after chart
Together they will show exactly what was said, when it was said, and what happened afterwards
There is no hindsight
No editing
No changing the narrative after the move
In this first example you will see that while the vast majority were becoming increasingly bullish just a few weeks ago, I was not
Why?
Because the structure was not showing any bullish signs
The structure is my guide
I simply follow it
🎥 Original Video
The video below was shared with paying subscribers on 30th of April 2026
I was very clear with my analysis
There was no impulse
The structure remained corrective
The highest probability was a drop to new lows
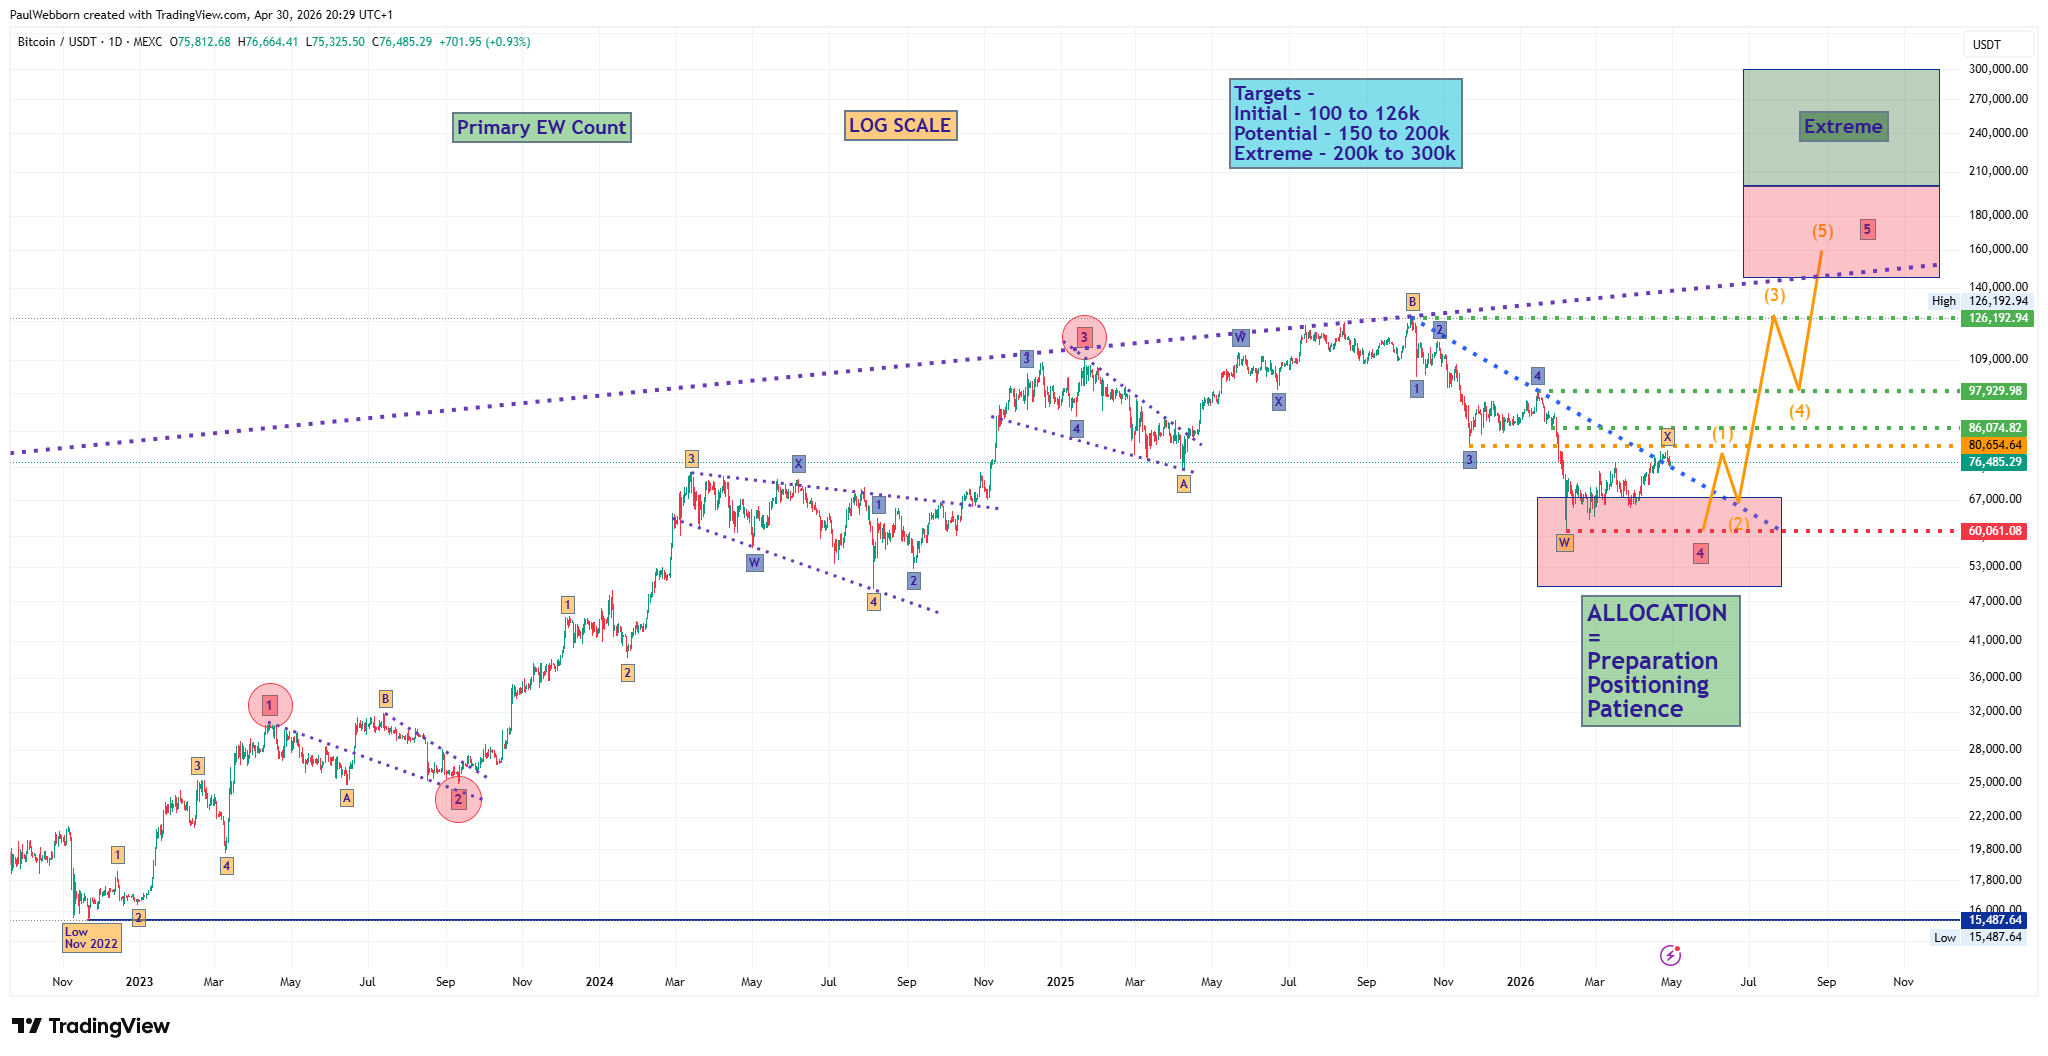
📊 Original Chart
The chart below was shared alongside the video on 30th of April 2026
At the time many believed the lows were in on February 5th
As the next couple of months unfolded, it became clear there was no impulse
The structure remained corrective
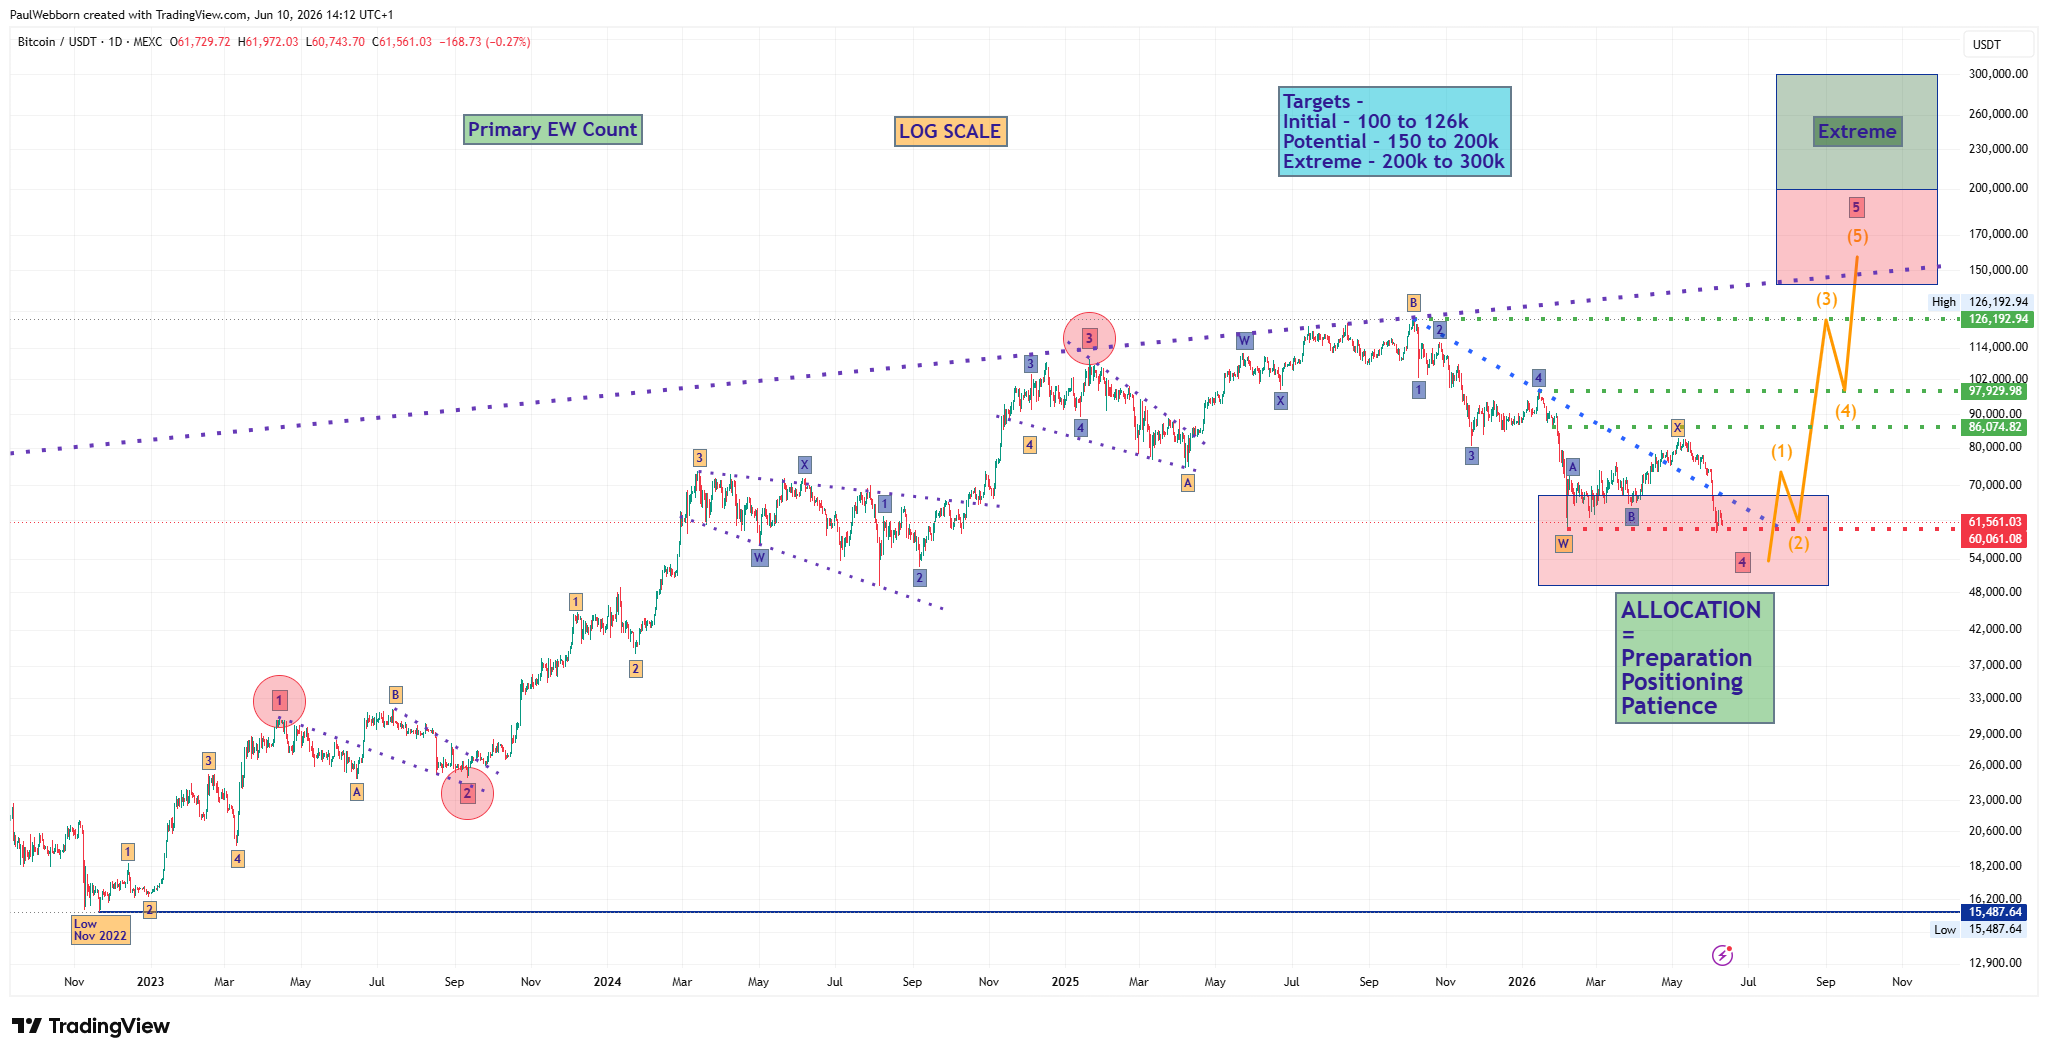
📊 Current Chart
This is today’s chart for BTC
As we can clearly see, the impulse never arrived
My analysis was mapped out weeks in advance
It played out and we now see new lows
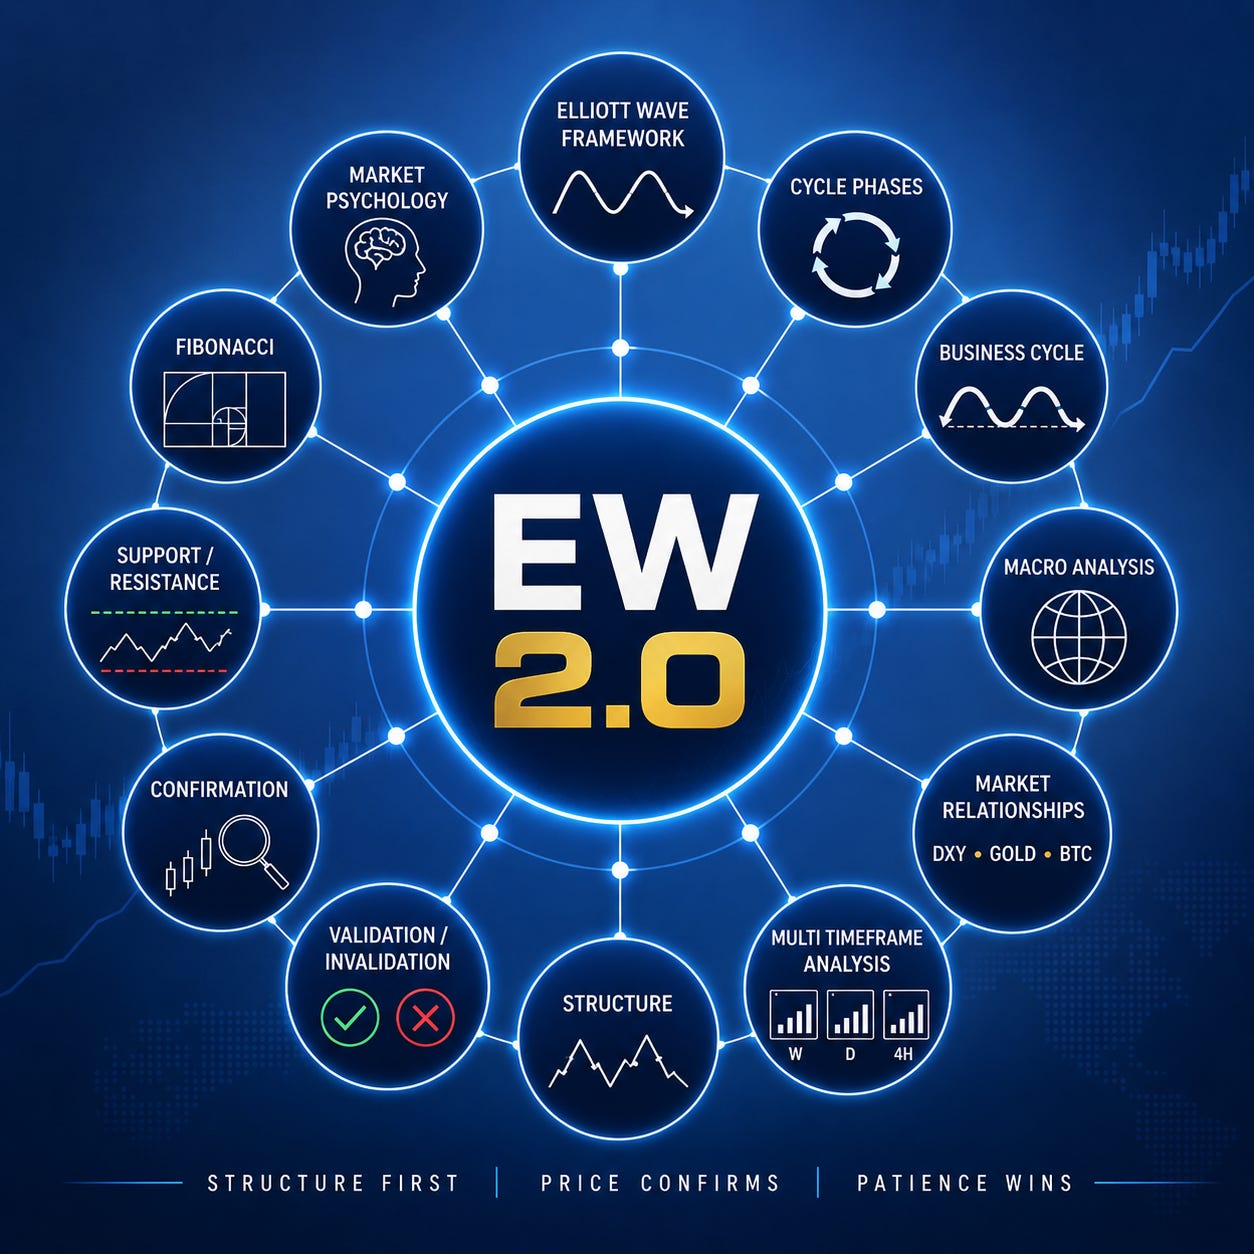
🧩 Elliott Wave 2.0
Many people make the mistake of thinking I simply analyse Elliott Waves
The reality is very different
Every piece of analysis is built using information from the whole market
My Framework looks at:
Elliott Wave Framework
Cycle Phases
Business Cycle
Macro Analysis
Market Relationships
Multi Timeframe Analysis
Structure
Validation and Invalidation
Confirmation
Support and Resistance
Fibonacci
Market Psychology
I analyse the whole risk asset market:
Metals
Indices
Stocks
Crypto
And most importantly, how they all interact with each other
Understanding these relationships is critical
The Elliott Wave count is only one piece of the puzzle
⚖️ The Key Lesson
This example demonstrates why I focus on structure rather than emotion
Many believed the correction had already completed
The structure suggested otherwise
The structure remained corrective
The impulse never arrived
The correction continued
This isn’t just Elliott Wave analysis
This is Elliott Wave 2.0
The structure is my guide
I simply follow it
Paul 👍🏻
#ElliottWaveEducation
Disclaimer
The content provided on this channel is for informational and educational purposes only. It does not constitute financial advice, investment recommendations, or an offer to buy or sell any securities. The authors of this channel are not licensed financial advisors
Any investment decisions should be made based on your own research, individual risk tolerance, and, where appropriate, consultation with a qualified financial professional
Financial markets involve risk, and past performance is not indicative of future results. Market conditions and individual financial circumstances vary and may not align with the analysis, structures, or views expressed here
The authors accept no liability for any losses or damages arising directly or indirectly from the use of this content
By engaging with this material, you acknowledge that you are solely responsible for your own investment decisions
Hi Mr. Paul, could you share with us your 3 top alts in % wise? Mean In which you can see most possibility in gains? Thank you
Hi Paul!
Henrik says a push till +/- 100k (with explosion of alts) and then a drop much lower during recession. On the contrary, your chart shows a 5-wave push up (after new lows). Is this something you don’t agree on, or am I missing something?
Many thanks!
Kind regards,
Michaël