
NASDAQ vs BTC
The market may already have shown us the low

Good evening everyone 👋🏻
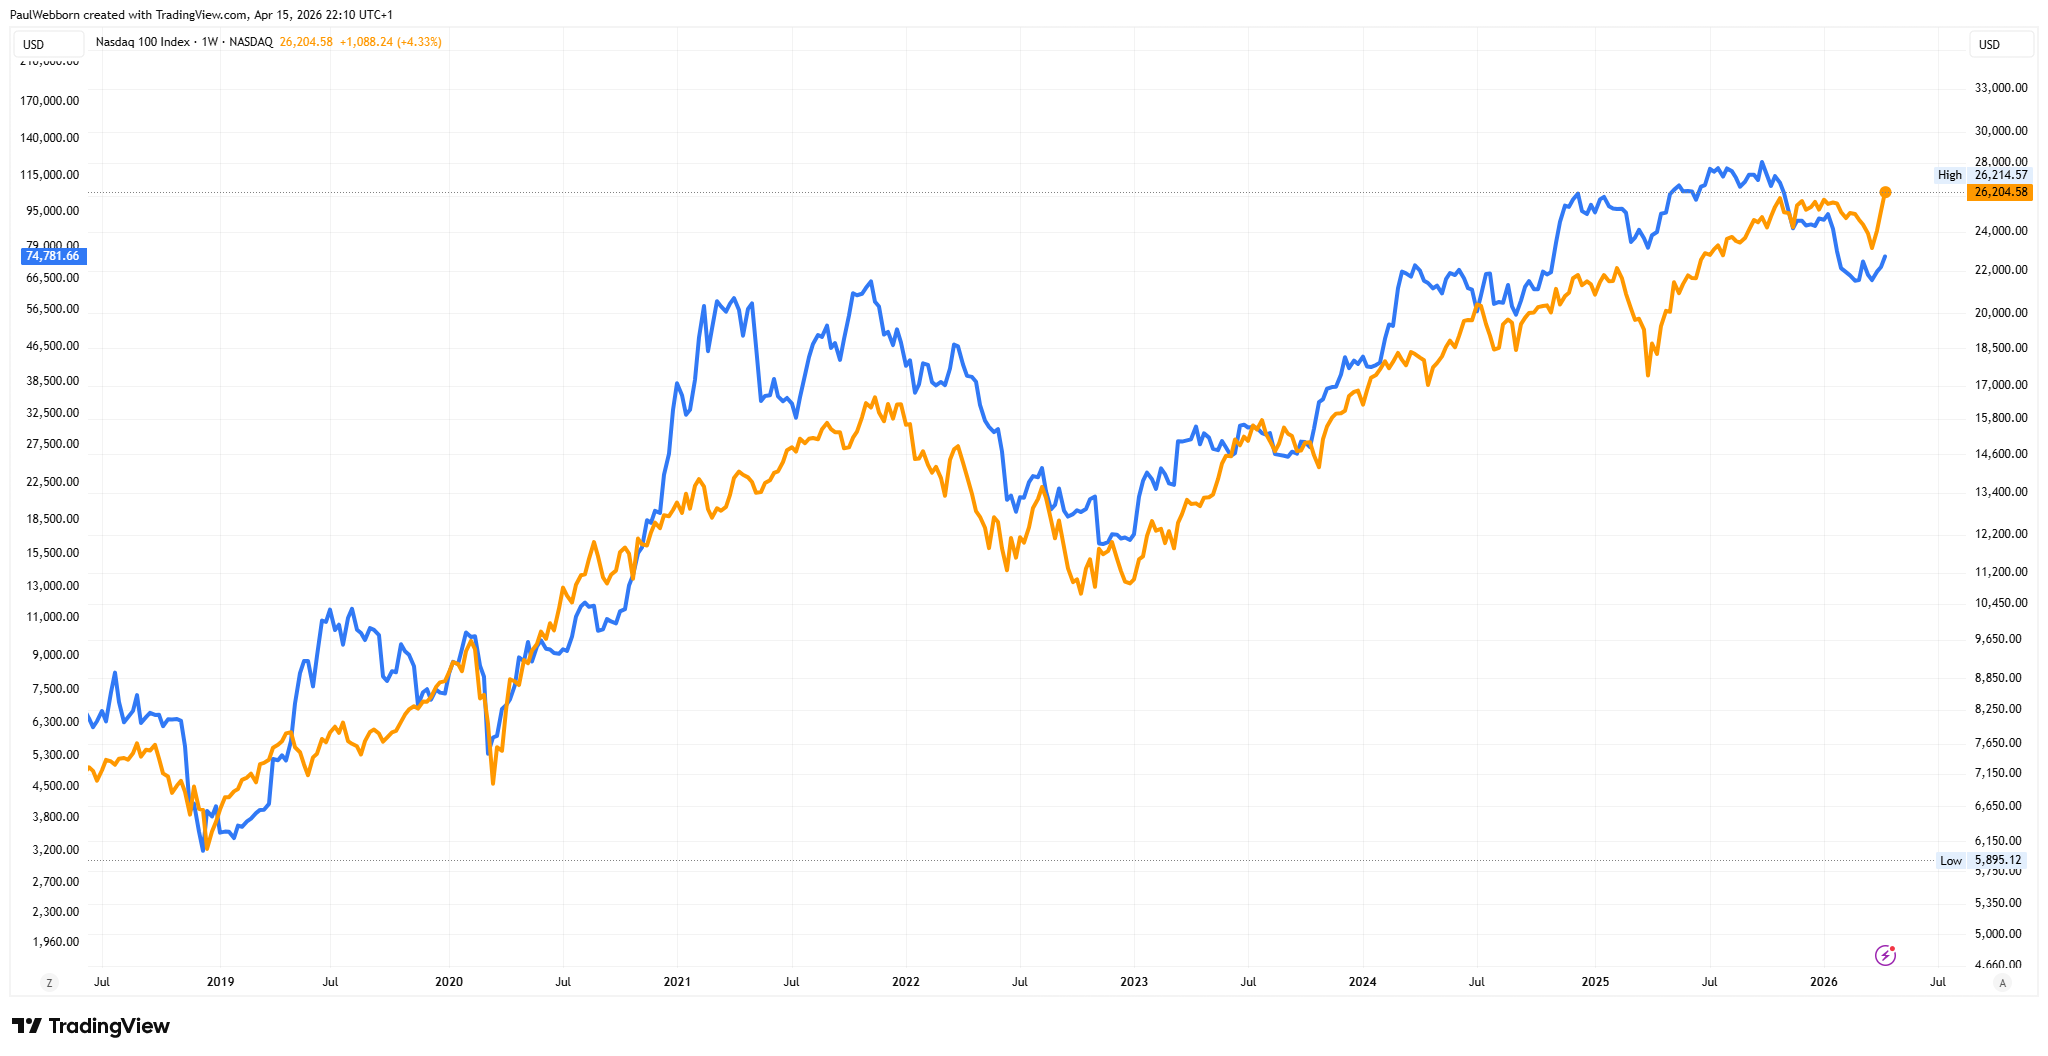
I have overlaid BTC on top of the NASDAQ
🟠 NASDAQ is in orange
🔵 BTC is in blue
It is clear how closely BTC follows the NASDAQ
Not to the exact day
But very closely
This relationship has been consistent since 2019
Across multiple cycles
And most importantly
At key turning points
The indices formed lows around March 30th / 31st
This is an important reference point
Historically
When indices form a low
BTC tends to follow very closely
If this relationship continues to hold
It supports the view that BTC is forming
or has already formed a similar low
This aligns with the broader structure:
Allocation phase developing
Corrective phase completed or very close
Positioning zones being built
This is where discipline matters
Chasing further downside at this stage
increases the risk of being left behind
if the move confirms higher
Note -
This is not confirmation
We still require validation from price
Allocation has been clear for weeks
Positioning during fear
is where the opportunity is created
#ElliottWaveEducation
Disclaimer
The content provided on this channel is for informational and educational purposes only. It does not constitute financial advice, investment recommendations, or an offer to buy or sell any securities. The authors of this channel are not licensed financial advisors
Any investment decisions should be made based on your own research, individual risk tolerance, and, where appropriate, consultation with a qualified financial professional
Financial markets involve risk, and past performance is not indicative of future results. Market conditions and individual financial circumstances vary and may not align with the analysis, structures, or views expressed here
The authors accept no liability for any losses or damages arising directly or indirectly from the use of this content
By engaging with this material, you acknowledge that you are solely responsible for your own investment decisions
Paul, Last year you had posted consistently and it was very helpful showing the sequence of the rotation. As this melt up/blow off top progresses, can you please lay out your thoughts on how you expect the sequence of the rotation may unfold? QQQ/SPY/IWM/BTC/ETH....
Thank you so much and really enjoy. your videos and sticking with the consistent process.
Very interesting👍
Do you analyse the BTC/NASDAQ chart as a key indicator (rotation)? Its weekly RSI was down at around 24 in late February.
And by the way when you analyse ratio-charts do you also then always use the log. version?