

Good morning, everyone 😀
As this is the first video update of 2026, I wanted to make this one available to all subscribers, free and paid.
This update walks through Bitcoin’s current Elliott Wave structure across multiple timeframes, outlining the key scenarios ahead and, most importantly, the levels that define them.
What this update covers
• Clear Elliott Wave structure across higher and lower timeframes
• The primary and alternative scenarios currently in play
• Validation and invalidation levels — what must happen vs what cannot happen
• Key support and resistance areas derived from structure, not emotion
• Whether price is still corrective or beginning a new impulsive phase
This is clear analysis and not opinion-based commentary.
Everything is framed around structure, probabilities, and confirmation.
How to use this update
This is a decision-zone environment, where patience matters more than prediction.
Whether price moves slightly lower or begins to break higher, the structure will confirm the next move. Until then, the focus remains on:
• Respecting key levels
• Letting price do the confirming
• Avoiding forced trades
Slow price action at these stages is normal and often constructive.
Important note
If you haven’t already, I strongly recommend reading through the pinned post on Substack.
It clearly outlines my approach for 2026, how these videos are structured, and how they integrate with the written analysis.
That framework applies to every update going forward.
Thank you, as always, for the continued support, thoughtful questions, and high-level discussion.
I’m looking forward to building this out properly with you all in 2026.
Paul 👍🏻
Chart 1 - 4 hr timeframe Elliott Wave Analysis
🟠 Intermediate waves 1 and 2 are complete
🟠 Intermediate wave 3 is in play, subdividing into:
🟦 Minor waves 1–5
🟦 Minor wave 1 is complete
🟦 Minor wave 2 is now potentially complete
🟦 Minor wave 3 may now be in play and should attack the current ATH
…….
The probability of a further move into the blue box has shifted from 70/30 to 50/50 based on recent price action.
Validation levels are shown by the green dotted lines.
Key focus:
🟢 The green circled area highlights an important price region around 95k
Invalidation is clearly defined below 80,650 (red dotted line).
Ultimate confirmation of this structure will be a new ATH.
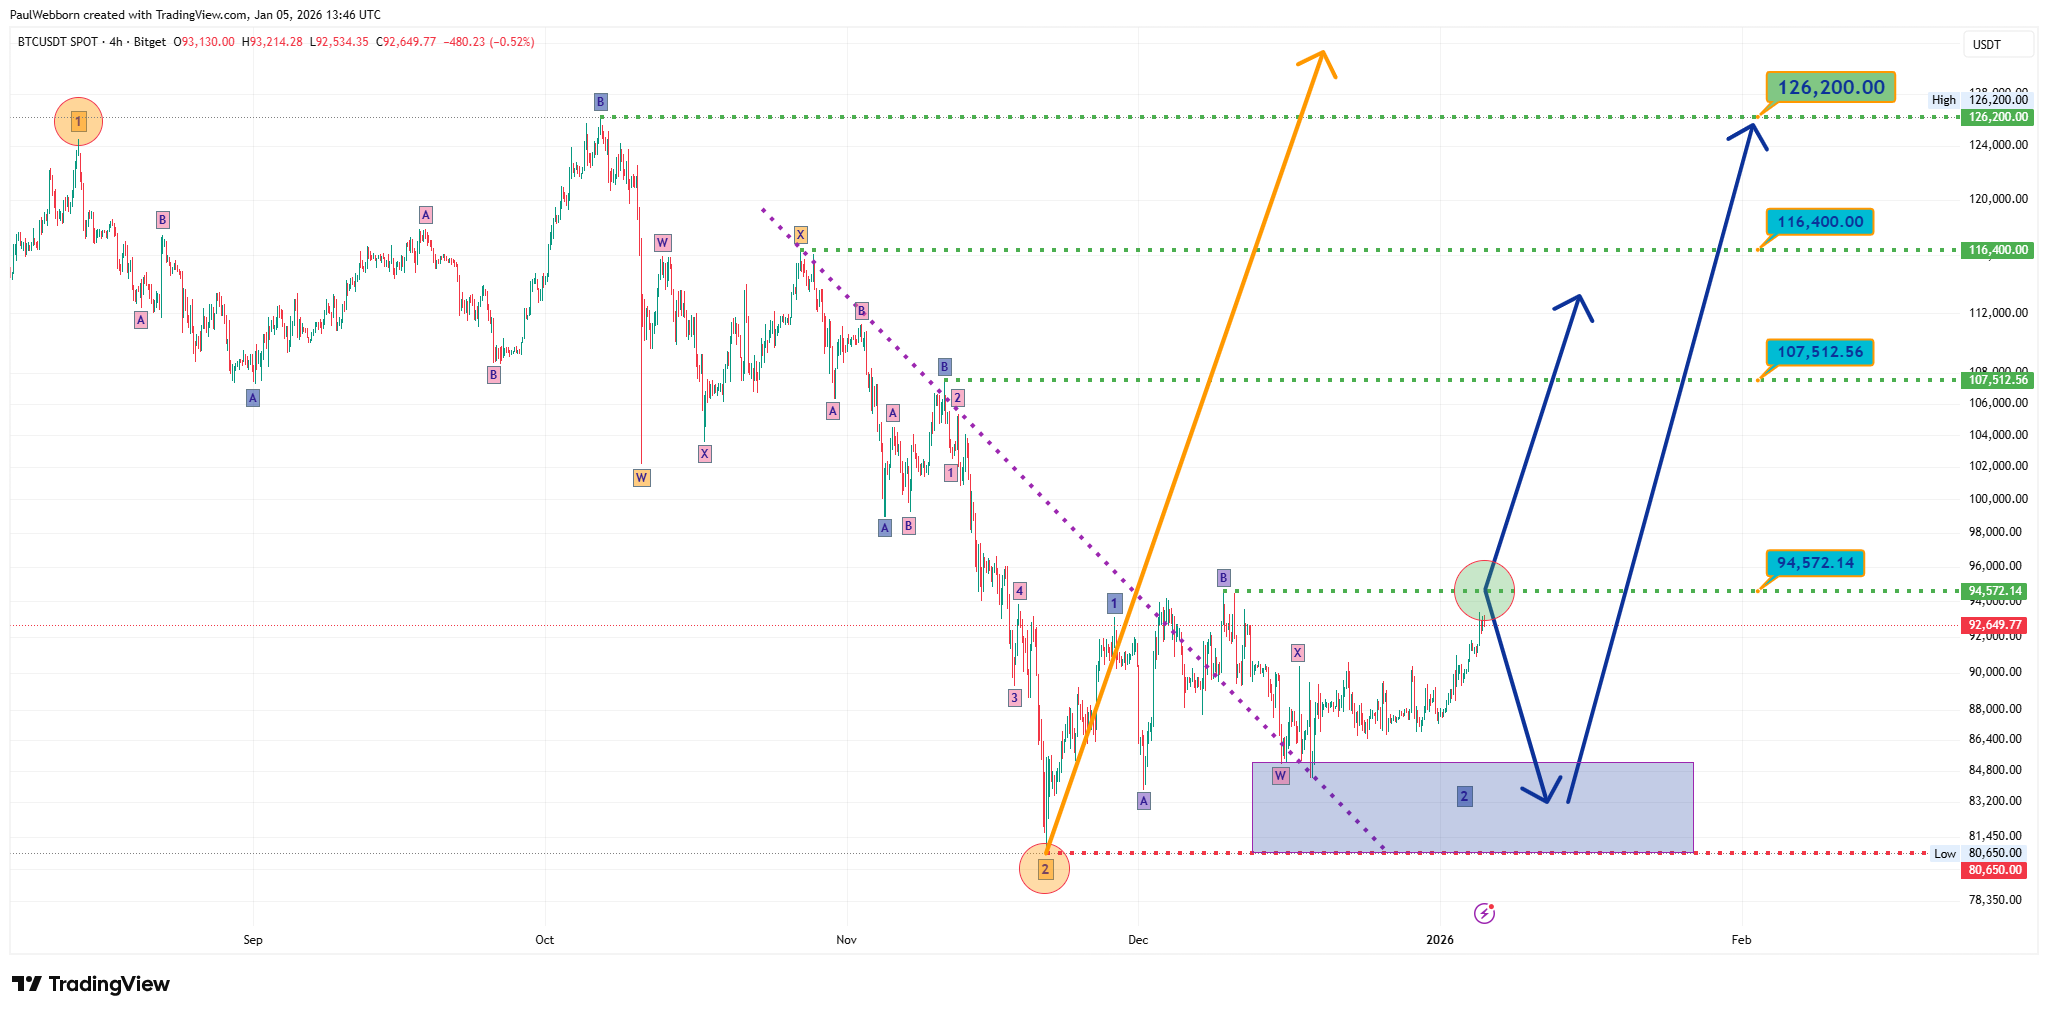
Chart 2 – Daily timeframe Elliott Wave Analysis
This is my higher-degree Elliott Wave count.
🟢 The green circles highlight previous continuation patterns, showing how price has historically consolidated before resolving higher.
Based on current structure, my primary expectation remains a break higher.
As always:
• A clear directional bias is provided
• Validation and invalidation levels are defined
• No single outcome is assumed
This chart lays out the structure clearly so you can see what must happen — and what cannot happen.
Price will confirm the next move.
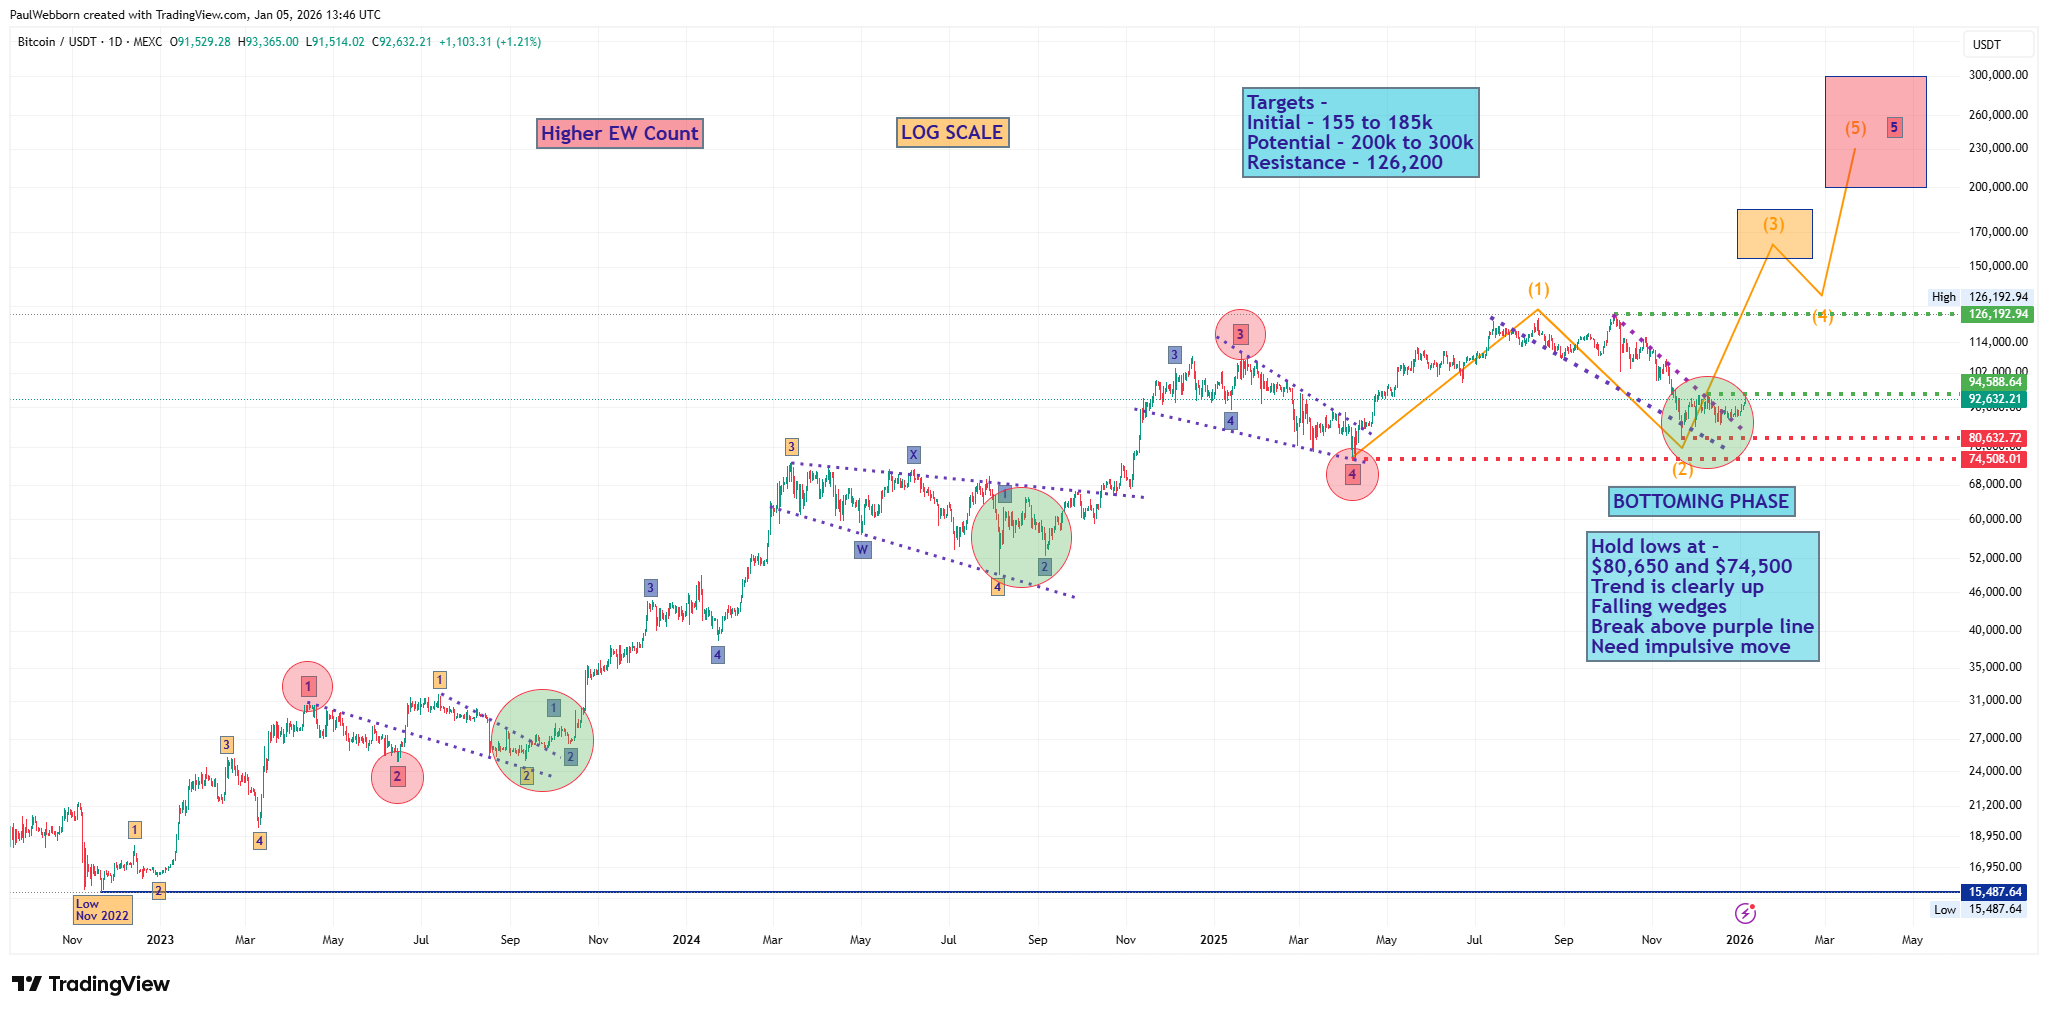
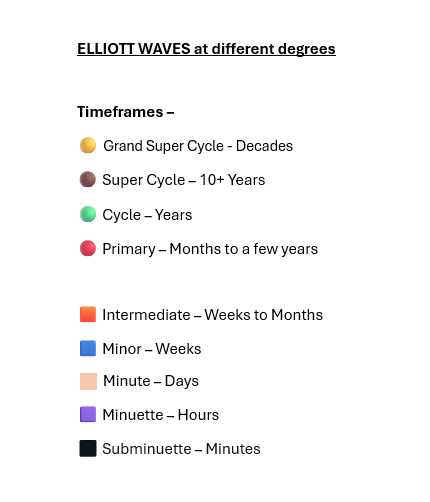
Image 3 – Elliott Waves at Different Degrees
This colour-coded structure is used consistently across every chart I share.
Understanding these wave degrees is essential, as it allows you to immediately identify where price sits within the broader market structure — not just the short-term move.
I strongly encourage you to familiarise yourself with:
• The colours
• The wave degree names
• The timeframes each degree represents
This framework is what ensures my analysis remains:
• Structured
• Context-driven
• Consistent across timeframes
Once this becomes second nature, following my Elliott Wave analysis becomes significantly easier, and it provides a solid foundation for your ongoing education and decision-making.
This is a key reference point and underpins all of my market analysis 👍🏻

#ElliottWaveEducation
…….
Disclaimer
The content provided on this channel is for informational and educational purposes only. It does not constitute financial advice, investment recommendations, or an offer to buy or sell any securities. The authors of this channel are not licensed financial advisors
Any investment decisions should be made based on your own research, individual risk tolerance, and, where appropriate, consultation with a qualified financial professional
Financial markets involve risk, and past performance is not indicative of future results. Market conditions and individual financial circumstances vary and may not align with the analysis, structures, or views expressed here
The authors accept no liability for any losses or damages arising directly or indirectly from the use of this content
By engaging with this material, you acknowledge that you are solely responsible for your own investment decisions
